Most people who handle money a lot (i.e. cashiers) can identify a lower-quality fake bill instantly just by touching it (wikiHow). Data analysts are like cashiers: a trained data analyst can detect anomalies “at a glance” when data are appropriately transformed. This proposal addresses the type of audio anomalies that human data analysts hear instantly: angry shouting, trucks at midnight on a residential street, gunshots. The human ear detects anomalies of this type rapidly and with high accuracy; for example, rifle magazine insertion clicks are detected with 100% accuracy at 0 dB SNR in white noise, babble, or jungle noise. Unfortunately, a data analyst can listen to only one sound at a time. Visualization shows the analyst many sounds at once, possibly allowing him or her to detect an anomaly several orders of magnitude faster than “real time.” This project has successfully rendered large audio data sets, comprising thousands of microphones or thousands of minutes, in the form of interactive graphics that reveal important anomalies at a glance.
This project was a collaboration between the Electrical and Computer Engineering Department and the Beckman Integrated Systems Laboratory, made possible by the Beckman Institute, and by grant 0807329 from the NSF.
- Grant: NSF 0807329
- Press: See the sounds as visual image
- People
- Research
- Results
People
This project was a collaboration between ECE and ISL, made possible by the Beckman Institute.
- Investigators
- Camille Goudeseune
- Mark Hasegawa-Johnson
- Thomas Huang
- Hank Kaczmarski
- Students
- Kai-Hsiang Lin
- Sarah Borys
- David Cohen
- Xi Zhou
- Xiaodan Zhuang
Research
This project was funded by NSF grant 0807329, and achieving the following research results:
- Data Transformations: Multiscale Spectrograms | Psychophysical Features | Salience-Maximizing Features | AED Likelihood Features
- Software and Data Testbeds: | Timeliner | Milliphone | Willard Airport Audio | HCI Experiments
- Unsupervised Class Discovery
- Web-Based Multimedia Analytics
Data Transformations
Transform audio into a visual representation that facilitates rapid search for anomalous events.
Multiscale Spectrograms
Physiological and Psychophysical Features
Salience-Maximizing Features
AED Log Likelihood Features
David Cohen and Camille Goudeseune developed a computationally efficient algorithm for simultaneously computing the short-time Fourier transform at every window size between 1-sample and 32768-samples.
Sarah King has developed, for purposes of improved visualization of audio signals, a binaural model of the auditory system, including explicit models of the basilar membrane (BM), of six different neuron types in the cochlear nucleus, and of their projections into the olivary nucleus. Experiments currently under way will test this representation for the automatic detection of speech and nonspeech acoustic landmarks.
The problem of feature transformation for multimedia analytics can be reformulated as the problem of maximizing mutual information between the perceived and ground-truth salience of the visualized signal. Kai-Hsiang Lin and Xiaodan Zhuang have developed a representation that, if certain types of audio signals are known to be uninteresting and routine (e.g., speech in a meeting room), suppresses the visual salience of such signals. The resulting display significantly accelerates the rate at which subjects are able to find anomalous acoustic events; see Kai-Hsiang Lin’s 2012 ICASSP paper.
We have developed visualization features based on our contribution to the Acoustic Event Detection (AED) evaluations sponsored by the project Classification of Events, Activities and Relationships (CLEAR). The AED project included two sub-goals: (1) Classification sub-goal sought to correctly classify discrete isolated events into one of 12 labeled categories (door snak, paper shuffling, footsteps, knocking, hair moving, phone ringing, spooncup jingle, key jingle, keyboard, applause, cough, and laughter), (2) Detection sub-goal sought to correctly detect and label the same 12 event categories in a business meeting recorded by multiple tabletop, wall-mounted, and headset microphones. All tested systems performed well in the Classification sub-task (typically 90 percent accuracy). In the Detection task, the best performance of only 34 percent accuracy was achieved by Xi Zhou and Xiaodan Zhuang’s HMM recognizer with AdaBoost feature selection. Since 2007 we have substantially improved system accuracy by the use of supervector rescoring and audiovisual fusion.
Software Testbeds:
Develop software testbeds for public outreach, and in order to evaluate data transformations in controlled experiments.
Timeliner
Milliphone
Willard Audio Dataset
Human-Computer Interface Experiments
The Timeliner application, developed by Camille Goudeseune, is a multi-parameter zoomable timeline, in the spirit of “non-linear editing” video editing suites. Displayed parameters include the waveform, the spectrogram, a spectrogram transformed to reduce the visual salience of non-anomalous events (salience-maximizing features), and a plot of the output log likelihoods from a bank of supervised classifiers (neural networks). RAM on a portable PC is currently sufficient to allow responsive zooming, with no user interface delay at all, over six orders of magnitude (at least 3600000:1). Results of public outreach deployments are reported in Mark Hasegawa-Johnson’s 2011 APSIPA paper.
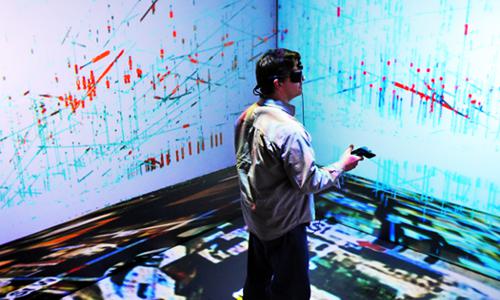
The Milliphone testbed, developed by Camille Goudeseune, ran in the Beckman Cube, a 6-sided virtual reality theatre. It extends Timeliner’s anomaly-finding task from one audio recording to multiple, simultaneous, geotagged recordings. The name is a pun on a thousand microphones, because it displays a thousand recordings with neither slowdown nor self-occlusion of data.
We recorded 11 hours of nonstop audio near a runway of the University of Illinois’ Willard Airport. We correlated this with public records of commercial takeoffs and landings, hoping to use them as indicators of anomalous sounds (similar nonanomalous sounds included ground traffic and HVAC machinery). Unfortunately, this recording was plagued with false positives from the many unschedulable takeoffs, touch-and-goes, and landings of the University’s own School of Aviation students.
Subjects participated in an “anomaly detection” experiment. For each of several three-hour recordings, they had ten minutes to find as many anomalous acoustic events as possible. Eight subjects performed this experiment, each under three conditions: Audacity (baseline audio visualization); Timeliner with only multiscale spectrogram features; and Timeliner with log likelihood or salience-maximizing features. Subjects found far more anomalies with Timeliner than Audacity, apparently because of the former’s powerful zooming. Within Timeliner, subject performance was similar with spectrogram and salience-maximizing features. Salience-maximizing features performed better than spectrograms, but this trend was not statistically significant. Results are reported in Kai-Hsiang Lin’s 2012 ICASSP paper.
Audio Class Discovery
Anomalies, by definition, don’t happen very often. Zipf’s law applies: if your training data contain an example of the acoustic event you’re looking for, then by definition, that event is not anomalous. It is therefore necessary to develop some sort of technique that will detect classes in the test data that were never heard in the training data, and to learn models of those classes. Tentatively we plan to do this by extending the methods described in Jui-Ting’s 2008 Speech Prosody paper.
Web-Based Multimedia Analytics
Visual analysis of text often leverages parametric semantic spaces, computed using methods such as latent semantic analysis. Typically a parametric semantic space is computed by creating a feature vector for each document, then transforming the document vector using a transform matrix: x = W d. The feature vector d characterizes the m’th document. It is typically of very high dimension, e.g., it may contain one entry for each word in the dictionary. The semantic vector x must be of a much lower dimension, so that it may be easily visualized; the transform matrix W is therefore a short, wide matrix, computed in order to summarize the important semantic distinctions among documents in a training database. Audio documents can be easily inserted into the x = W d framework by computing a feature vector d for each audio document. The feature vector is unlikely to be commensurate with feature vectors computed for text databases, therefore it will not be immediately possible to merge the d spaces computed for text and audio databases; the goal during the first part of this research will be simply to generate feature vectors d and transform matrices W that summarize audio documents well enough to allow the creation of visually analyzable document clusters, themes, and semantic spaces.
Results
- Saliency-enhanced features halve the error rate of human analysts.
- Audio visualization permits anomaly detection at 8X real time.
- CLEAR AED Competition: acoustic event detection
Saliency-enhanced features halve the error rate of human analysts.
In our 2012 ICASSP paper, we demonstrated that human analysts tasked with detecting anomalies in a large audio file can halve their error rates (F-score increases from 0.3 to 0.6) by the use of a visualization tool in which visual saliency of the spectrogram is a monotonic function of estimated probability of an audio anomaly.
Audio visualization permits anomaly detection at 8X real time.
In our 2011 APSIPA paper we showed that the use of zoomable audio visualization tools allows some users to find audio “easter eggs” (anomalies, e.g., motorcycles, cuckoo clocks, and spaceships added in to a background composed of eight hours of orchestral music) at a rate eight times faster than they would achieve by simply listening to the audio.
CLEAR AED Competition: acoustic event detection
The 2007 CLEAR Acoustic Event Detection competition included two sub-goals: (1) Classification sub-goal sought to correctly classify discrete isolated events into one of 12 labeled categories (door snak, paper shuffling, footsteps, knocking, hair moving, phone ringing, spooncup jingle, key jingle, keyboard, applause, cough, and laughter), (2) Detection sub-goal sought to correctly detect and label the same 12 event categories in a business meeting recorded by multiple tabletop, wall-mounted, and headset microphones. All tested systems performed well in the Classification sub-task (typically 90 percent accuracy). In the Detection task, the best performance of only 34 percent accuracy was achieved by our HMM recognizer with AdaBoost feature selection. The second-best and third-best systems had AEDACC scores of 23% and 21%; the other two systems had AEDACC scores below 10%.
Since 2007 we have substantially improved system accuracy by the use of tandem neural network-Adaboost inputs (Adaboost+T) and Gaussian mixture supervector rescoring (Adaboost+S); the benefits of these two modifications are slightly super-additive (Adaboost+T+S; see our paper in Pattern Recognition Letters).